★ Featured App

Finmatics Autonomous Accounting
Interface for AI-driven document processing tool by Finmatics.
More information
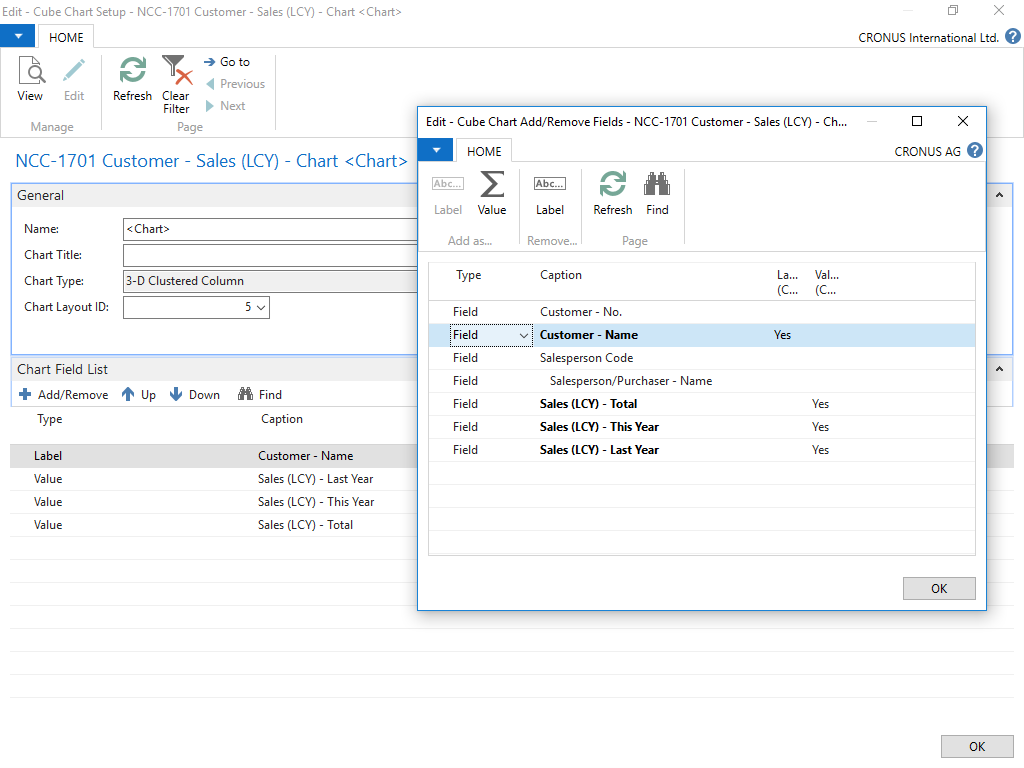 Steps for adding and setting up a Chart:
| Finmatics Autonomous Accounting Interface for AI-driven document processing tool by Finmatics. More information  |